![]()
NormMaker
Significantly enhance the interpretation and credibility of assessment results.
Benchmark group performance.
Login to the NormMaker Norm Generator
Quickly and effortlessly create norms for psychometric tests and instruments used in selection, assessment, personal and group development. Full norm tables allow you to evaluate performance using stanines, stens, percentile distribution, or standard scores. Quality control of your instrument is provided for by descriptive statistics, reliability coefficients and indications of the characteristics of the distribution. You can also view your data by graphing the distribution profile, including the position of stanines. |
|||||||||||||||||||||||||||||||
FEATURES
|
|||||||||||||||||||||||||||||||
| EXPLAINING THE
CONCEPT OF NORMSThe completion of a
test or questionnaire results in a raw score reflecting how the person has accomplished
the task. However, knowing a raw score does not tell a great deal about the person's
actual performance on the test or questionnaire. In order to evaluate performance, we need
a standard against which we can compare. In this way we are able to evaluate the person's
performance relative to a group who we are interested in. Norms provide us with such a
context. For example, if a person has obtained a raw score of 90 out of 100 for a test of
some kind, we may initially think this performance is very good. However, if we compare
this score to other people we are interested in and find that they score 95 or higher, it
means that the performance of the person we are looking at is in fact low relative to the
norm.
Further, using raw scores, we cannot identify how a person has performed across a range of tests or questionnaires unless we can get a standard which can be applied to all the tests. Using norms to evaluate performance, we may find that somebody performs strongly using language skills, but is relatively weak in computational skills. Norms therefore provide a frame of reference with which to view a candidate's performance. Norms are constructed from a set of scores of candidates that are representative of the population you are measuring or comparing against. A candidate's scores can then be directly compared with the norm group, and the relative performance of the candidate can be identified by how the candidate falls in the distribution of scores on the norm table. In this way one can tell whether a candidate is anything from very poor or low, to average, to exceptional on an ability or characteristic. Lets have a look at some examples of how norms can be used:
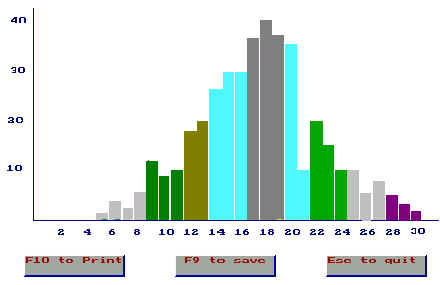
Measurements taken on large groups of people will generally create a distribution which takes the approximate form of a normal bell shaped curve. For example, if we have a look at the shoe size of the adult male population, it will fall in a range of scores from very small to very large, with the majority of people somewhere in the middle. The normal curve is characterised by a concentration of observations in the middle and as the distance from the central point increases on either side, the incidence of people is reduced. By plotting the distribution above, we can see where any particular shoe size will be located on the normal distribution. These distributions also exist for other measures such as height, weight, and even blood pressure. Similar principles can be established for psychometric tests and questionnaires which are measuring a particular ability or trait. Using the information of a distribution we can make assessments and even predictions about outcomes. For instance, shoe makers will cater for the central tendency of sizes by making a large number of shoes between sizes seven and nine. Few shoes will be made smaller and larger than this, because the market is relatively smaller. In the case of psychometric measurements, we can locate a person's performance on the distribution curve and it will tell us whether he or she scored very well, average, or low on the quality relative to the distribution of the sample. Norms therefore provide the following benefits: ! They provide a real life criterion through which we can establish a standard. ! They describe the quality of an individual's performance by comparing his or her score with the distribution of people similar to him or her. ! They allow us to compare the performance of an individual on two or more instruments or measures because they represent standard scales of measurement. Tests and other instruments vary in difficulty and they seldom consist of the same number of items. Norms overcome these difficulties by providing a standardised way of viewing performance. No matter how tests may vary in length or difficulty, we can compare the person's performance against a common standard using norms. Further, we may want to compare people to a variety of different groups. So, for example, we can have a range of norms for a test varying from matriculants, through Technicon graduates, to University graduates. We can also develop norms for cultural groups where we know the instruments we are using are influenced by cultural factors. Separate norms may provide an unbiased way of assessing people on the same instrument and compensating for cultural bias in the instrument. The process utilised in NormMaker smooths and normalises the distribution of a set of scores to provide a norm table. The norm table can then be used to locate the raw score, and identify where the person falls in the distribution. The norm tables that are produced by NormMaker provide three ways in which we can view the distribution. These are: ! Standard Scores ! Percentile Ranks ! Stanines
|
|||||||||||||||||||||||||||||||